Back in the early days of grad school I used to use Prism GraphPad a lot before switching to R. Prism is a great piece of software and I’ve seen scientists using them a lot. Recently I wanted to import a Prism .pzfx file into R, and as usual, I went to Google expecting there’ll be some readxl or readr equivalent for prism. Surprisingly, I didn’t find much more than this SO question. So, how do you import a prism file into R? The easiest way is probably exporting the prism file to a text file then read it into R. But this just doesn’t feel that good, right? So I started looking into the file structure of .pzfx files and tried to parse it by myself. Starting from Prism5, in addition to the binary file it also stores the data table in XML format which is possible to parse. After some trials and errors I made a little R package (github, CRAN) to read .pzfx files into R data frames. I’ll briefly document how it works here.
Example Prism files
As an example, I obtained some .pzfx files from this paper. The file for Fig 1 looks like this: 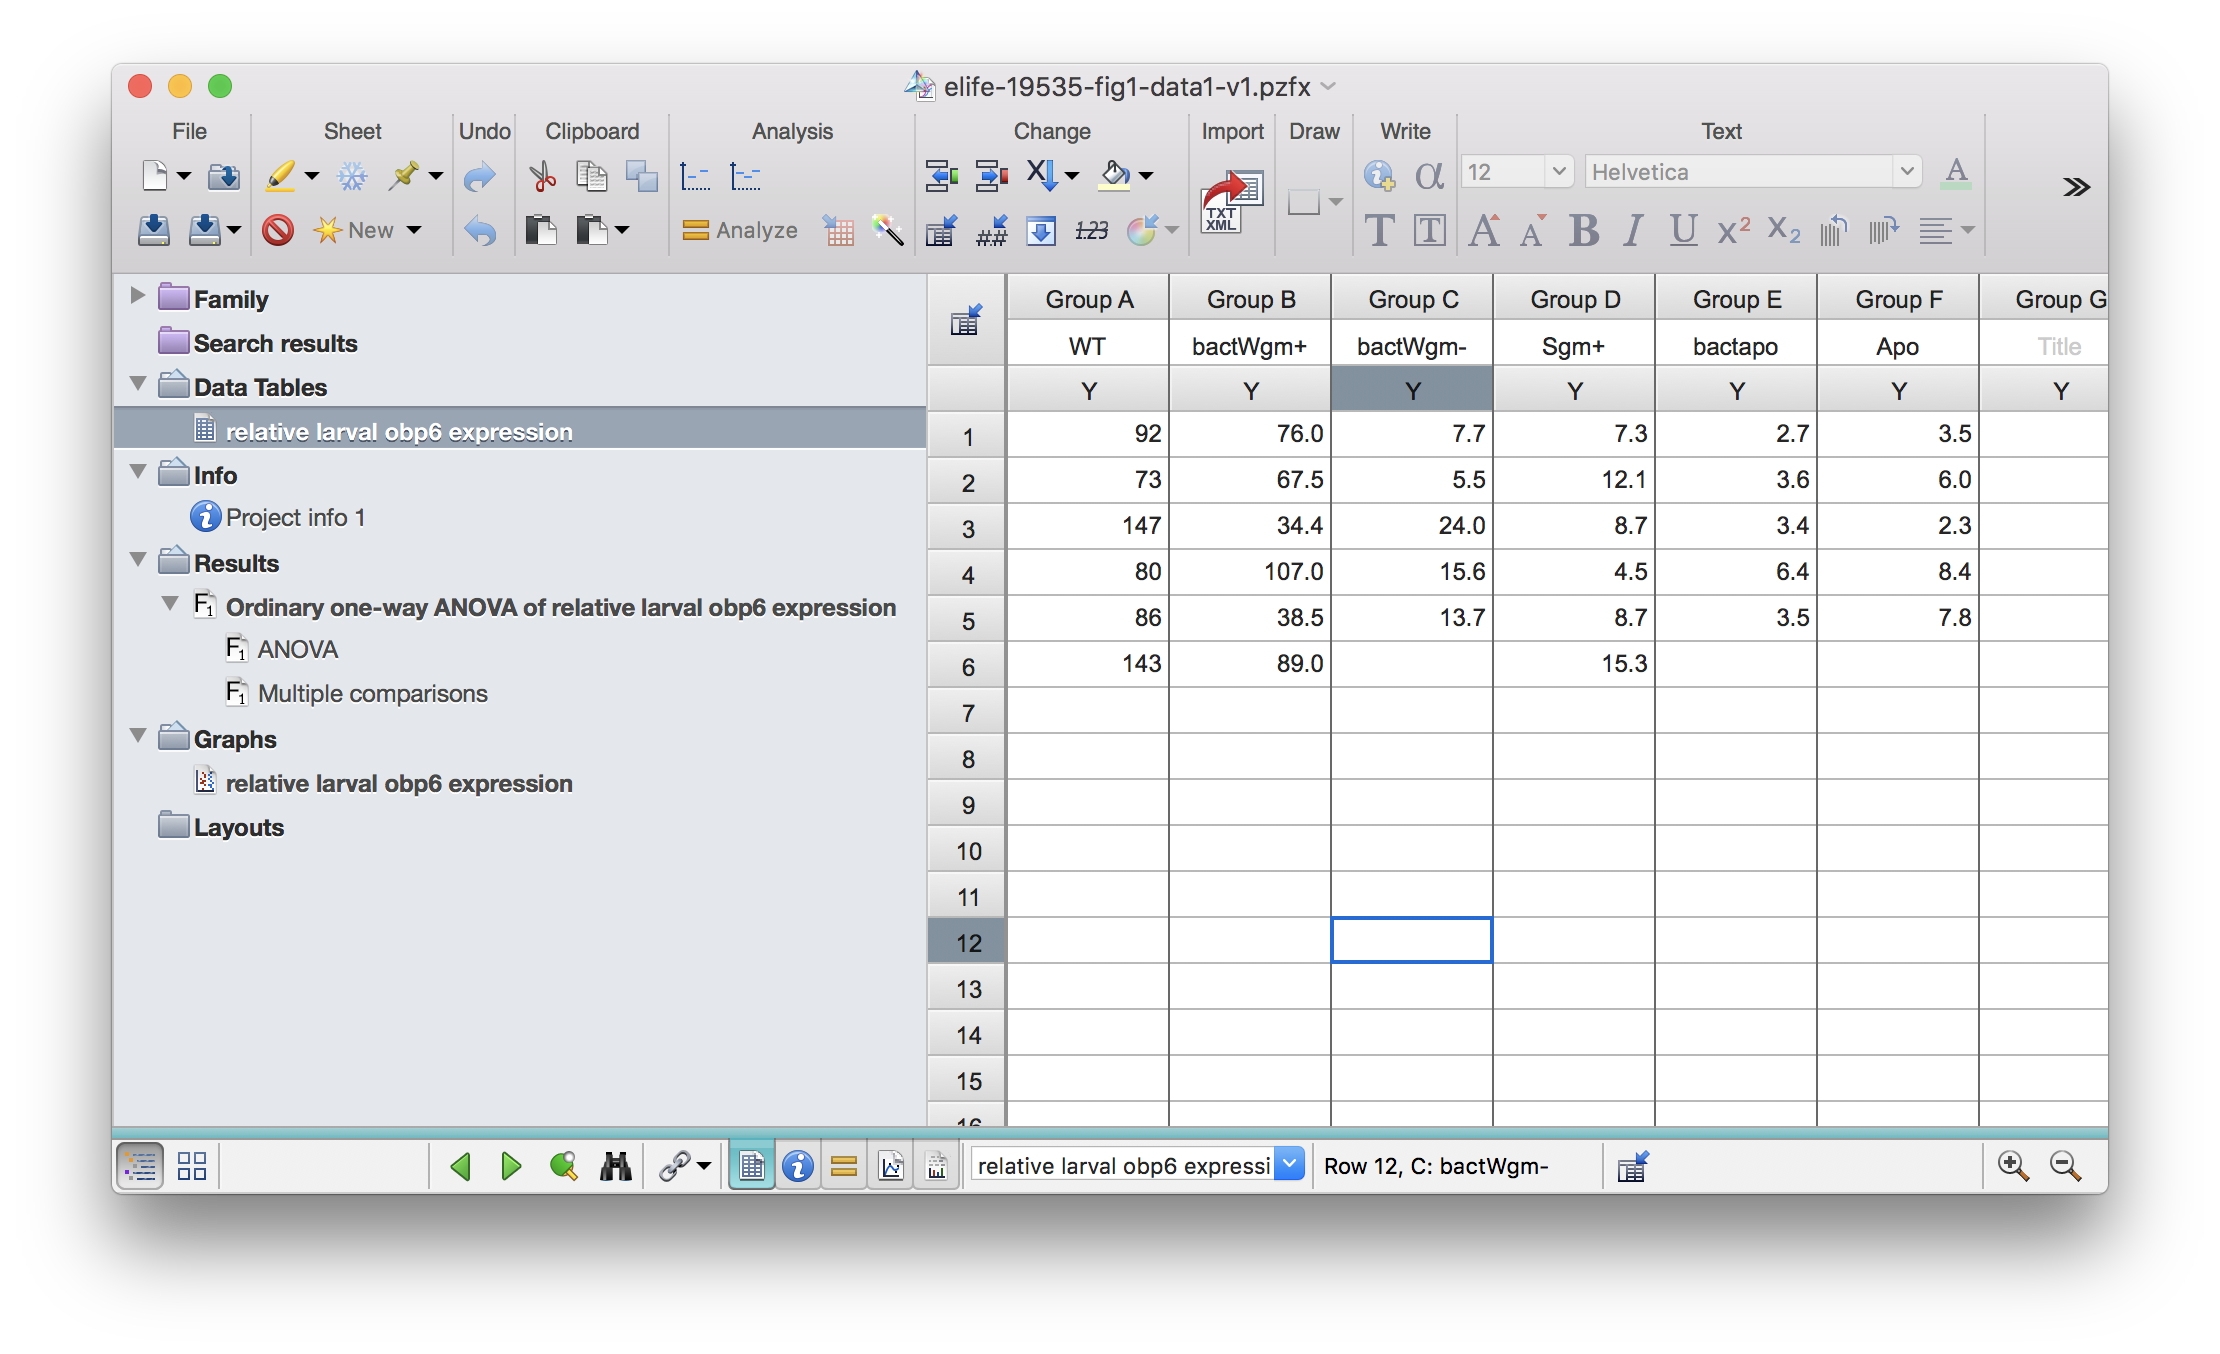
Main functionality
List tables from a .pzfx file:
library(pzfx)
pzfx_tables("../../static/data/benoit_elife_2017/elife-19535-fig1-data1-v1.pzfx")
## [1] "relative larval obp6 expression"Read one specific table into R:
df1 <- read_pzfx("../../static/data/benoit_elife_2017/elife-19535-fig1-data1-v1.pzfx", table="relative larval obp6 expression")NAs will be added if the columns are of different lengths.
df1## WT bactWgm+ bactWgm- Sgm+ bactapo Apo
## 1 92 76.0 7.7 7.3 2.7 3.5
## 2 73 67.5 5.5 12.1 3.6 6.0
## 3 147 34.4 24.0 8.7 3.4 2.3
## 4 80 107.0 15.6 4.5 6.4 8.4
## 5 86 38.5 13.7 8.7 3.5 7.8
## 6 143 89.0 NA 15.3 NA NAAdditional features
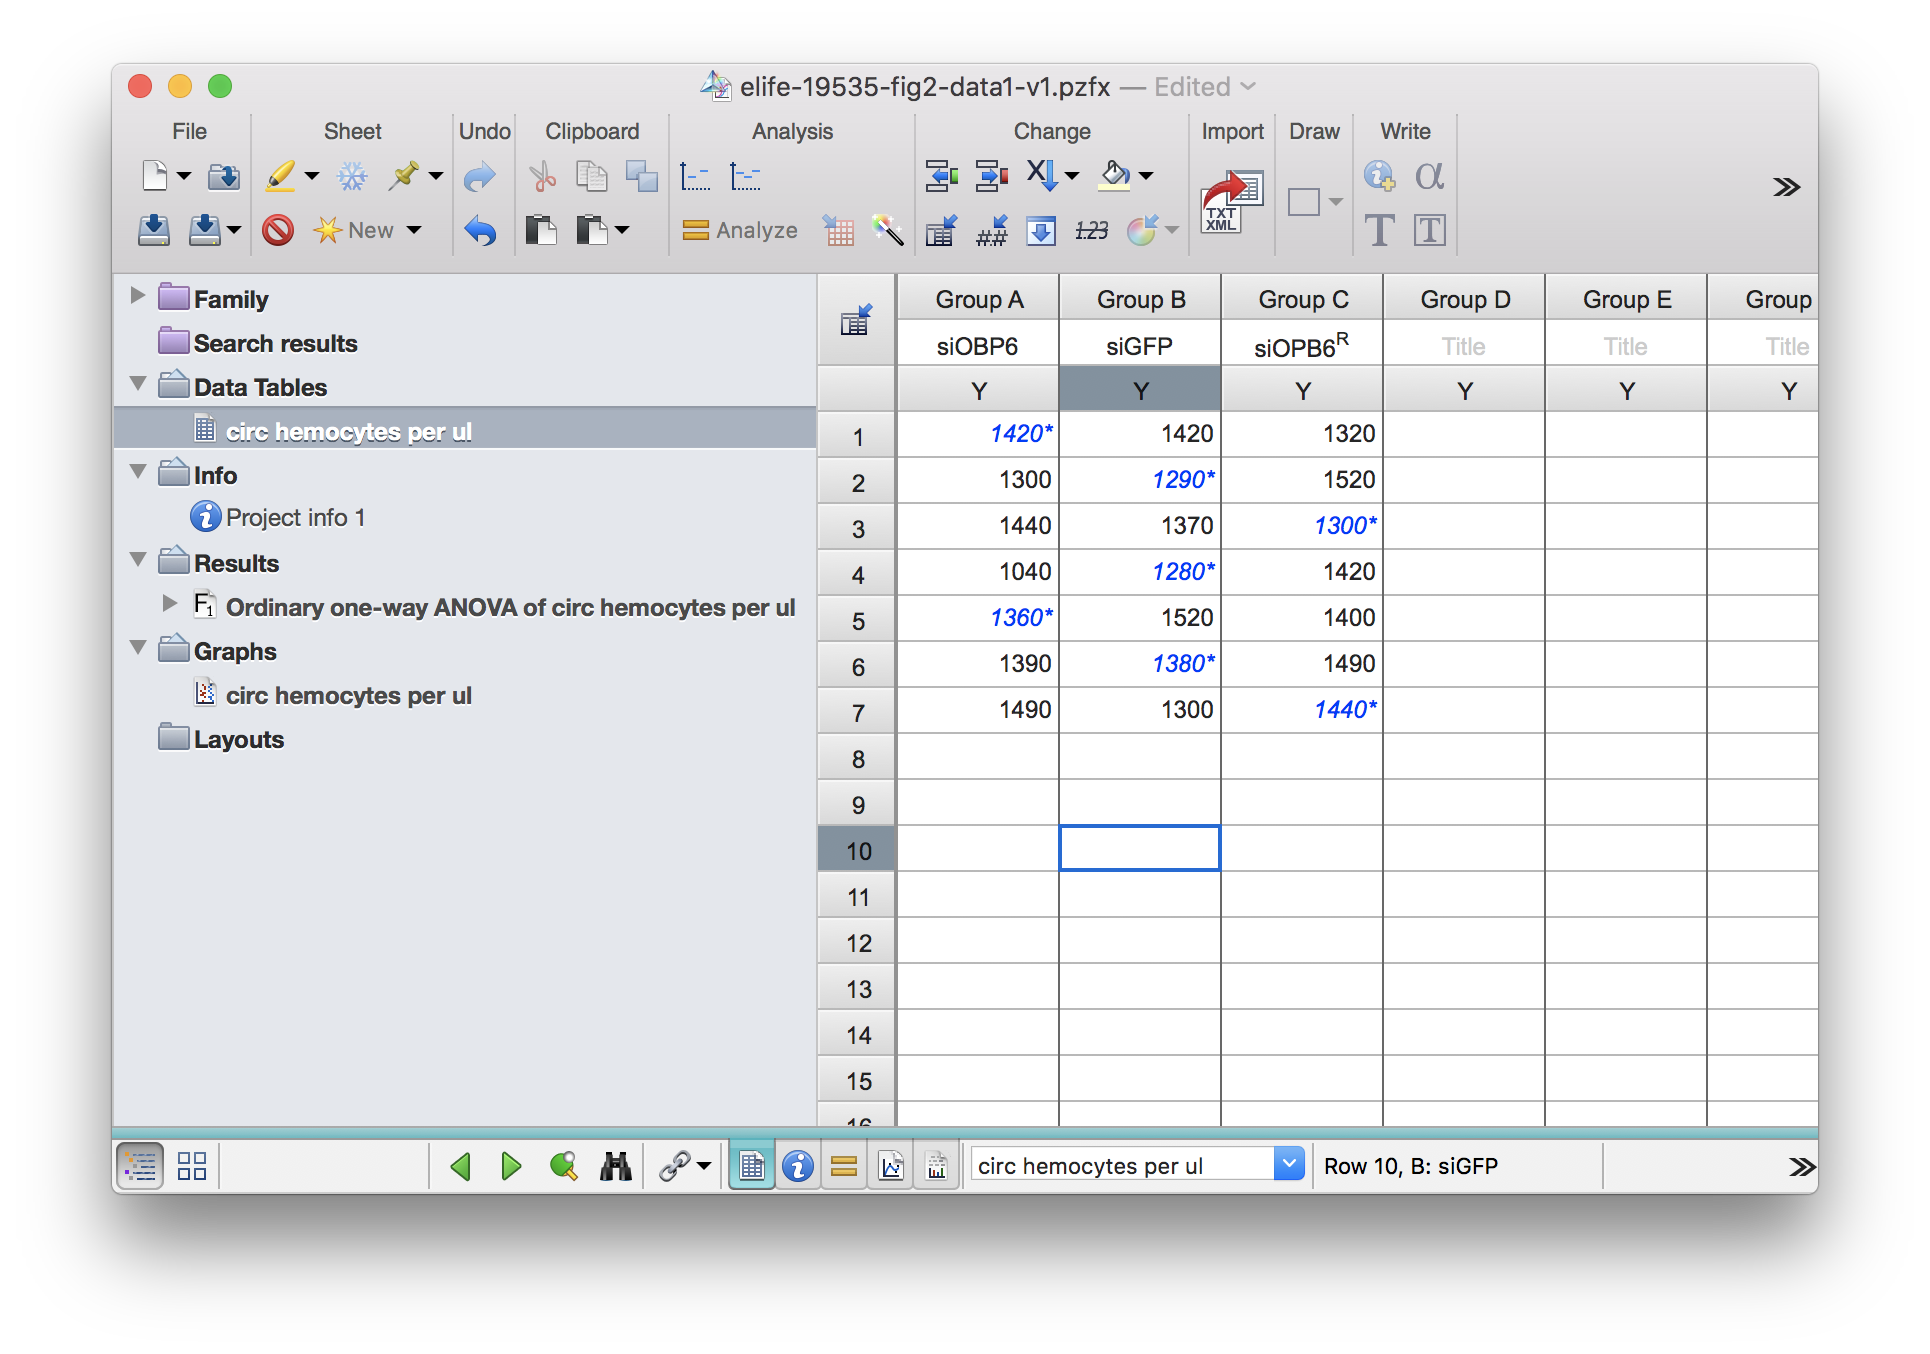
Prism allows user to strike out data. To accommodate this, an option strike_action is available in read_pzfx. One can choose to delete these values with strike_action="exclude", keep them with "keep", or convert them to a trailing "*" with "star". Note if strike_action="star" the entire table will be converted to type character.
Special formating of column names such as superscripts will be converted to regular strings.
For example (I striked out data myself from the original table) when the input looks like this:
df2_e <- read_pzfx("../../static/data/benoit_elife_2017/elife-19535-fig2-data1-v1_modified.pzfx",
                   table=1,
                   strike_action="exclude")
df2_e
## siOBP6 siGFP siOPB6R
## 1 NA 1420 1320
## 2 1300 NA 1520
## 3 1440 1370 NA
## 4 1040 NA 1420
## 5 NA 1520 1400
## 6 1390 NA 1490
## 7 1490 1300 NAdf2_k <- read_pzfx("../../static/data/benoit_elife_2017/elife-19535-fig2-data1-v1_modified.pzfx",
table=1,
strike_action="keep")
df2_k## siOBP6 siGFP siOPB6R
## 1 1420 1420 1320
## 2 1300 1290 1520
## 3 1440 1370 1300
## 4 1040 1280 1420
## 5 1360 1520 1400
## 6 1390 1380 1490
## 7 1490 1300 1440df2_s <- read_pzfx("../../static/data/benoit_elife_2017/elife-19535-fig2-data1-v1_modified.pzfx",
table=1,
strike_action="star")
df2_s## siOBP6 siGFP siOPB6R
## 1 1420* 1420 1320
## 2 1300 1290* 1520
## 3 1440 1370 1300*
## 4 1040 1280* 1420
## 5 1360* 1520 1400
## 6 1390 1380* 1490
## 7 1490 1300 1440*Like Excel, Prism also allows subcolumns. For example, you can have replicates in subcolumns:
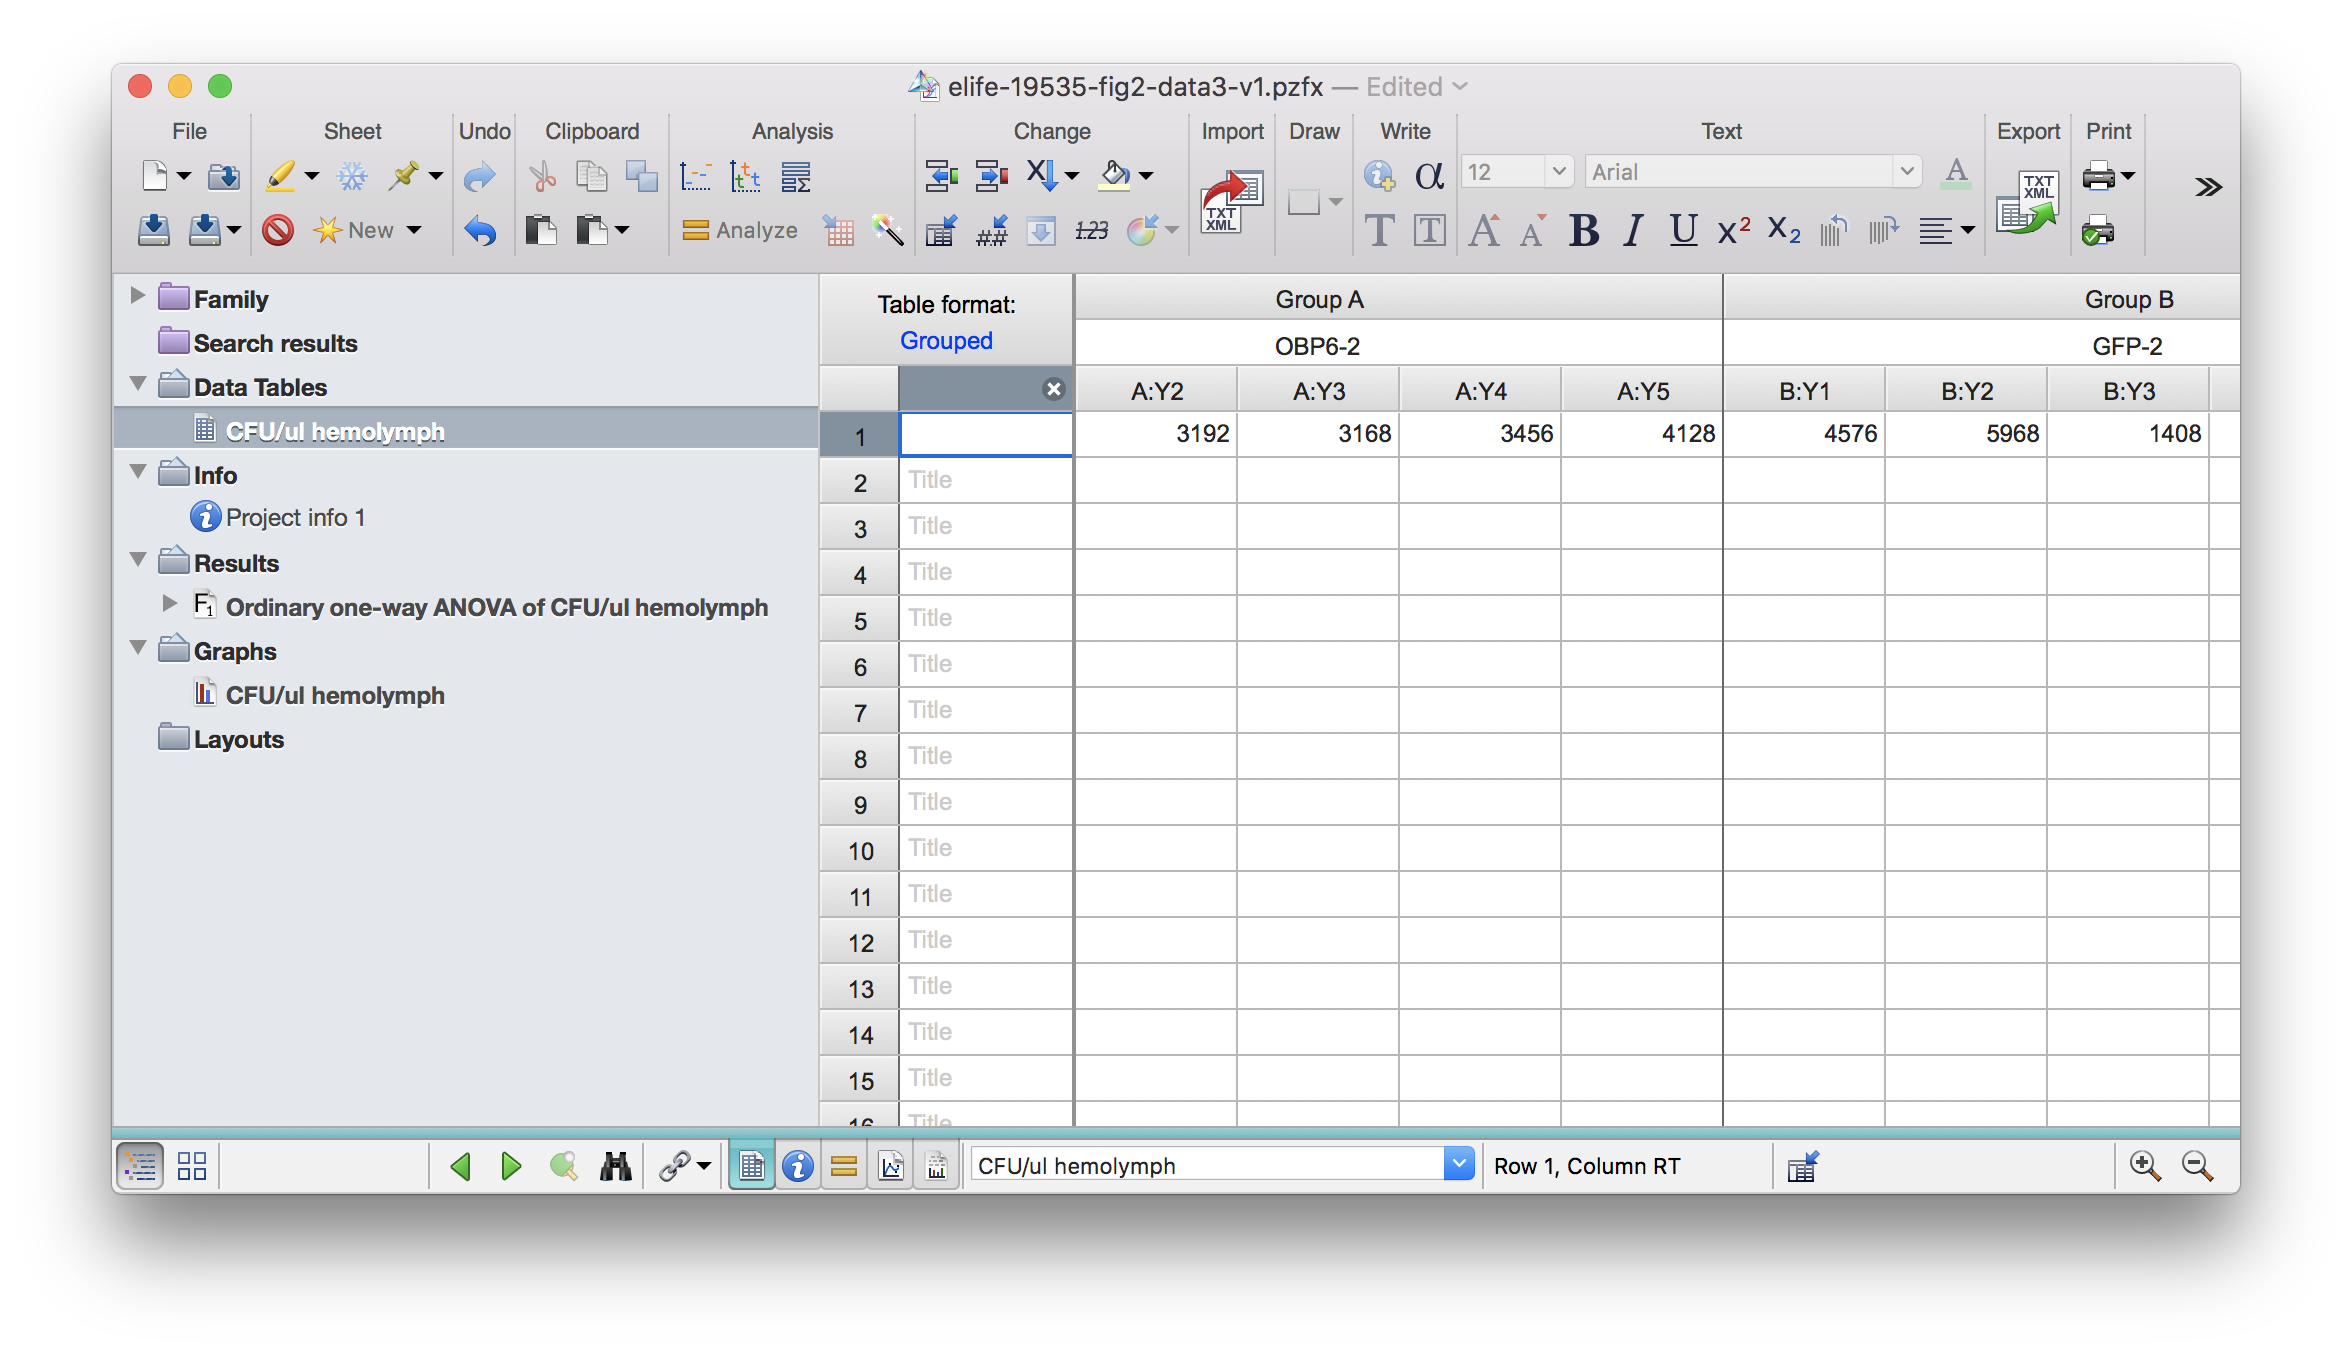
read_pzfx will automatically add _1, _2 etc to the original column name to account for sub columns if they are replicates.
df3 <- read_pzfx("../../static/data/benoit_elife_2017/elife-19535-fig2-data3-v1.pzfx")
df3
## OBP6-2_1 OBP6-2_2 OBP6-2_3 OBP6-2_4 OBP6-2_5 GFP-2_1 GFP-2_2 GFP-2_3
## 1 2448 3192 3168 3456 4128 4576 5968 1408
## GFP-2_4 GFP-2_5 OBP6R-2_1 OBP6R-2_2 OBP6R-2_3 OBP6R-2_4 OBP6R-2_5
## 1 3392 2304 5212 3491 2710 4672 4339
## OBP6-6_1 OBP6-6_2 OBP6-6_3 OBP6-6_4 OBP6-6_5 GFP-6_1 GFP-6_2 GFP-6_3
## 1 94 56 84 138 204 101 126 76
## GFP-6_4 GFP-6_5 OBP6R-6_1 OBP6R-6_2 OBP6R-6_3 OBP6R-6_4 OBP6R-6_5
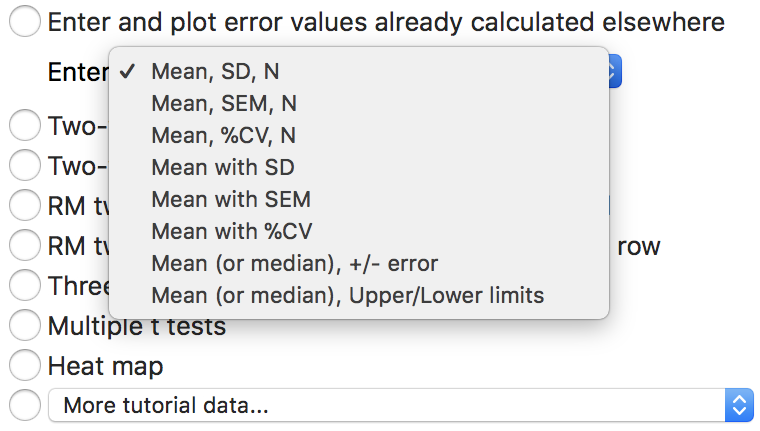
## 1 116 155 48 121 45 210 88But also you can have subcolumns to mean different things, for example the first is the mean, second standard deviation, third the number of observations.
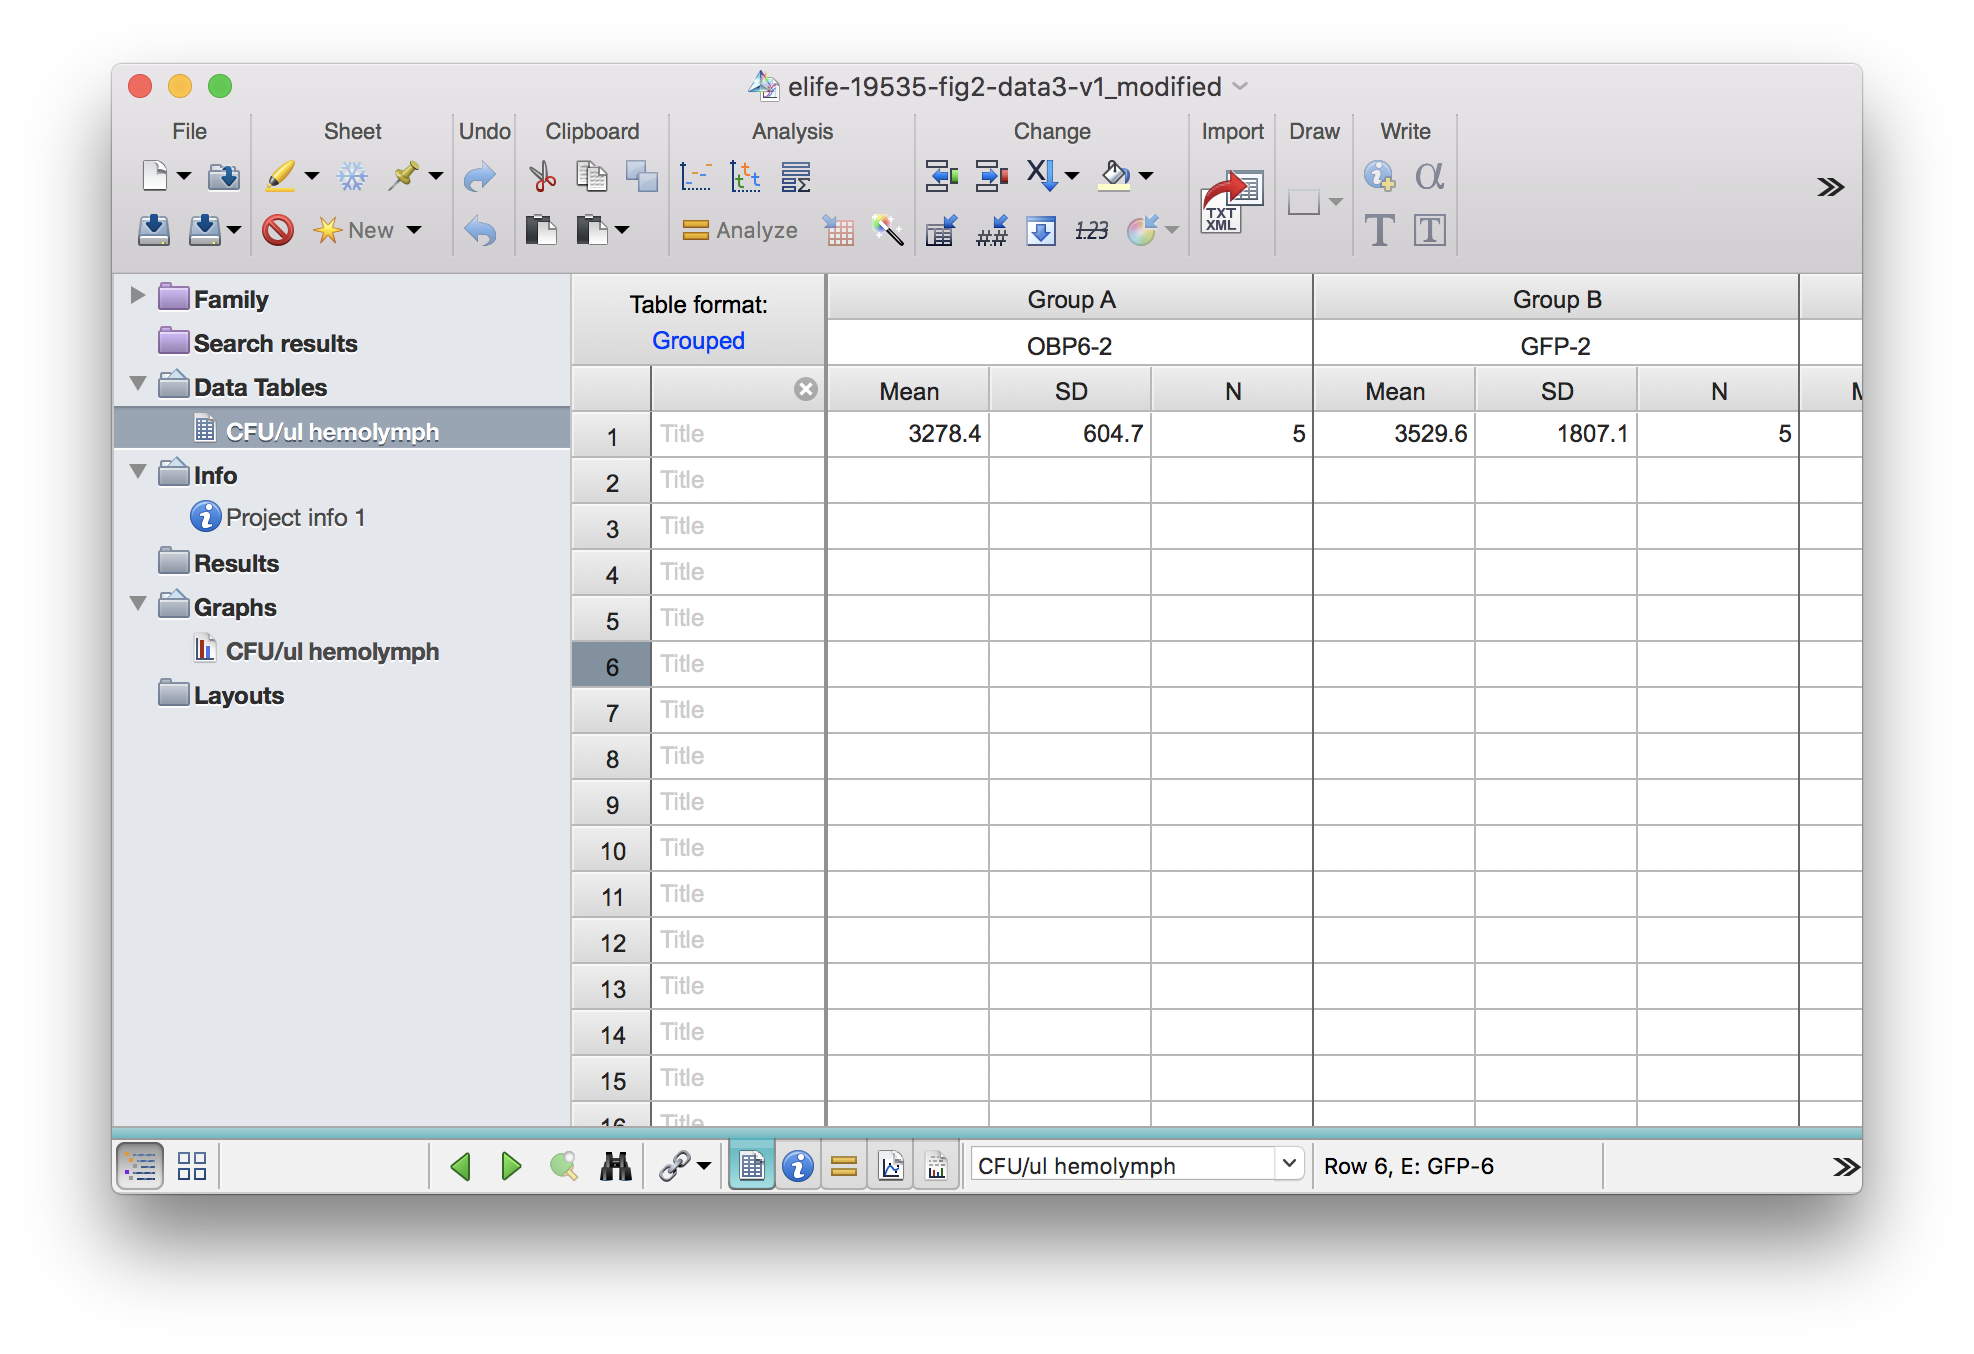
In this case, trailing _MEAN, _SD, _N will be added.
df3_mod <- read_pzfx("../../static/data/benoit_elife_2017/elife-19535-fig2-data3-v1_modified.pzfx")
df3_mod
## OBP6-2_MEAN OBP6-2_SD OBP6-2_N GFP-2_MEAN GFP-2_SD GFP-2_N OBP6R-2_MEAN
## 1 3278.4 604.6857 5 3529.6 1807.136 5 4084.8
## OBP6R-2_SD OBP6R-2_N OBP6-6_MEAN OBP6-6_SD OBP6-6_N GFP-6_MEAN GFP-6_SD
## 1 990.2872 5 115.2 57.73387 5 114.8 29.32064
## GFP-6_N OBP6R-6_MEAN OBP6R-6_SD OBP6R-6_N
## 1 5 102.4 67.79602 5Currently read_pzfx works for all these alternative subcolumn types by Prism7: